This feature is still under development and will be available soon. If you have any questions, please
Contact usLots of HR Data, But Hard to Turn Into Decisions
Without talent mapping based on measurable indicators, organizations tend to assess talent from fragmented information, such as KPI only, opinions, or assessment results alone. As a result, decisions become inconsistent across teams, difficult to justify, and development plans lack direction.
01.
"Top talent" is hard to agree on because evaluation standards vary.
02.
Promotion and rotation are prone to debate due to minimal structured evidence.
03.
High performers are not necessarily "fit" for the next role.
04.
Growth potential is not visible, so development programs miss the target.
05.
Difficult to determine intervention priorities because there is no clear segmentation.
Measurable Mapping, Not Just a Matrix
Jenjang integrates assessment data and daily work data into three core scores: Role Fit, Performance, and Potential. The result is not just a talent map, but also a clear foundation for developing recommendations and supporting talent-related decisions.
Clear 3-Score Model
Using three core scores, namely Role Fit, Performance, and Potential, produces a more comprehensive assessment because it does not rely on a single evaluation dimension.
Evidence-Based, Not Perception
Input integrates competency compatibility with role requirements, psychological assessment results and interests, KPI achievements, validated worklog, and development signals obtained from the coaching process.
Actionable Output
Each position on the map produces clear follow-up steps, such as development plan preparation, coaching focus determination, or role compatibility re-evaluation.
From Data to Score, Normalization, to Mapping
Talent Mapping at Jenjang is built from a combination of fairly assessed data. Weighting is adjusted to data quality, then normalization is performed so that cross-team comparisons become more transparent and consistent.
Assessment + daily work data
Role Fit measures competency compatibility with role requirements, reinforced by psychological assessment results and interests to understand work style and role preferences. Performance is assessed from KPI achievements, validated worklog, and task completion quality. Potential reflects development capacity, reviewed through cognitive and problem-solving indicators, learning agility, skill improvement trends (skill velocity), and coachability reflected from coaching and counselling processes.
Real behavior in the field
Weights follow rater/data count and recency
To maintain objectivity, all indicators are summarized into a talent map and translated into clear follow-up recommendations.
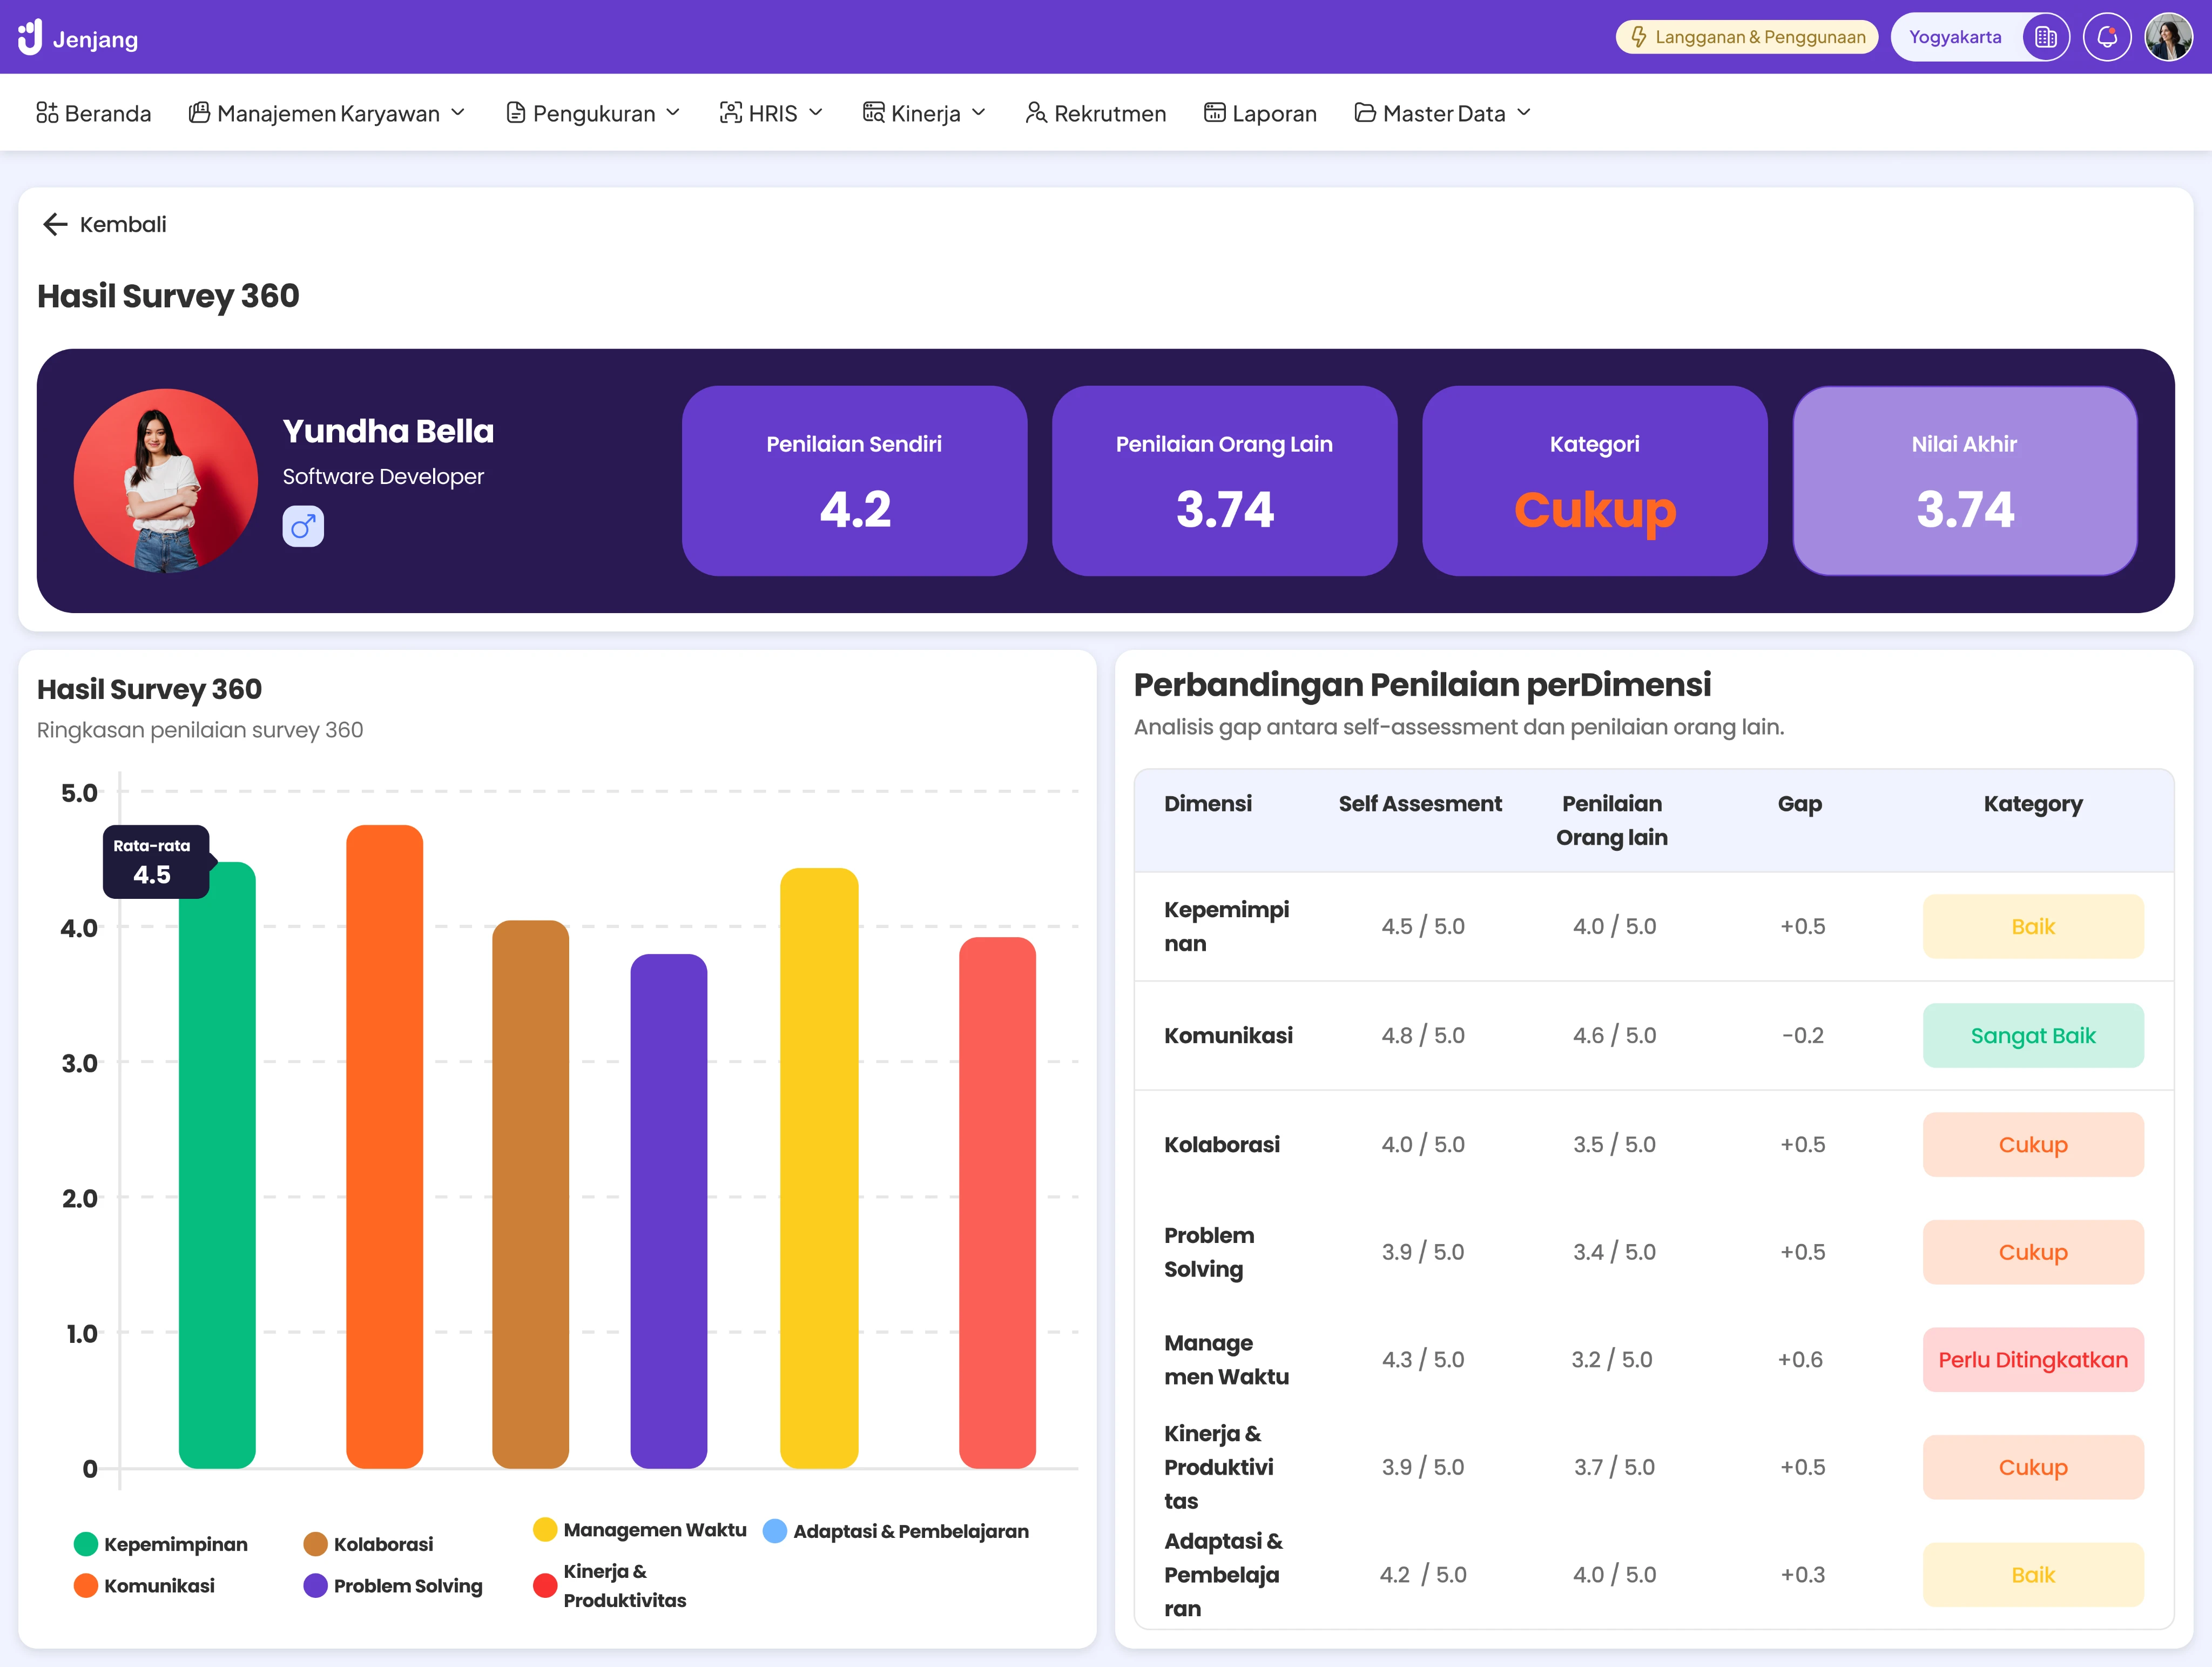
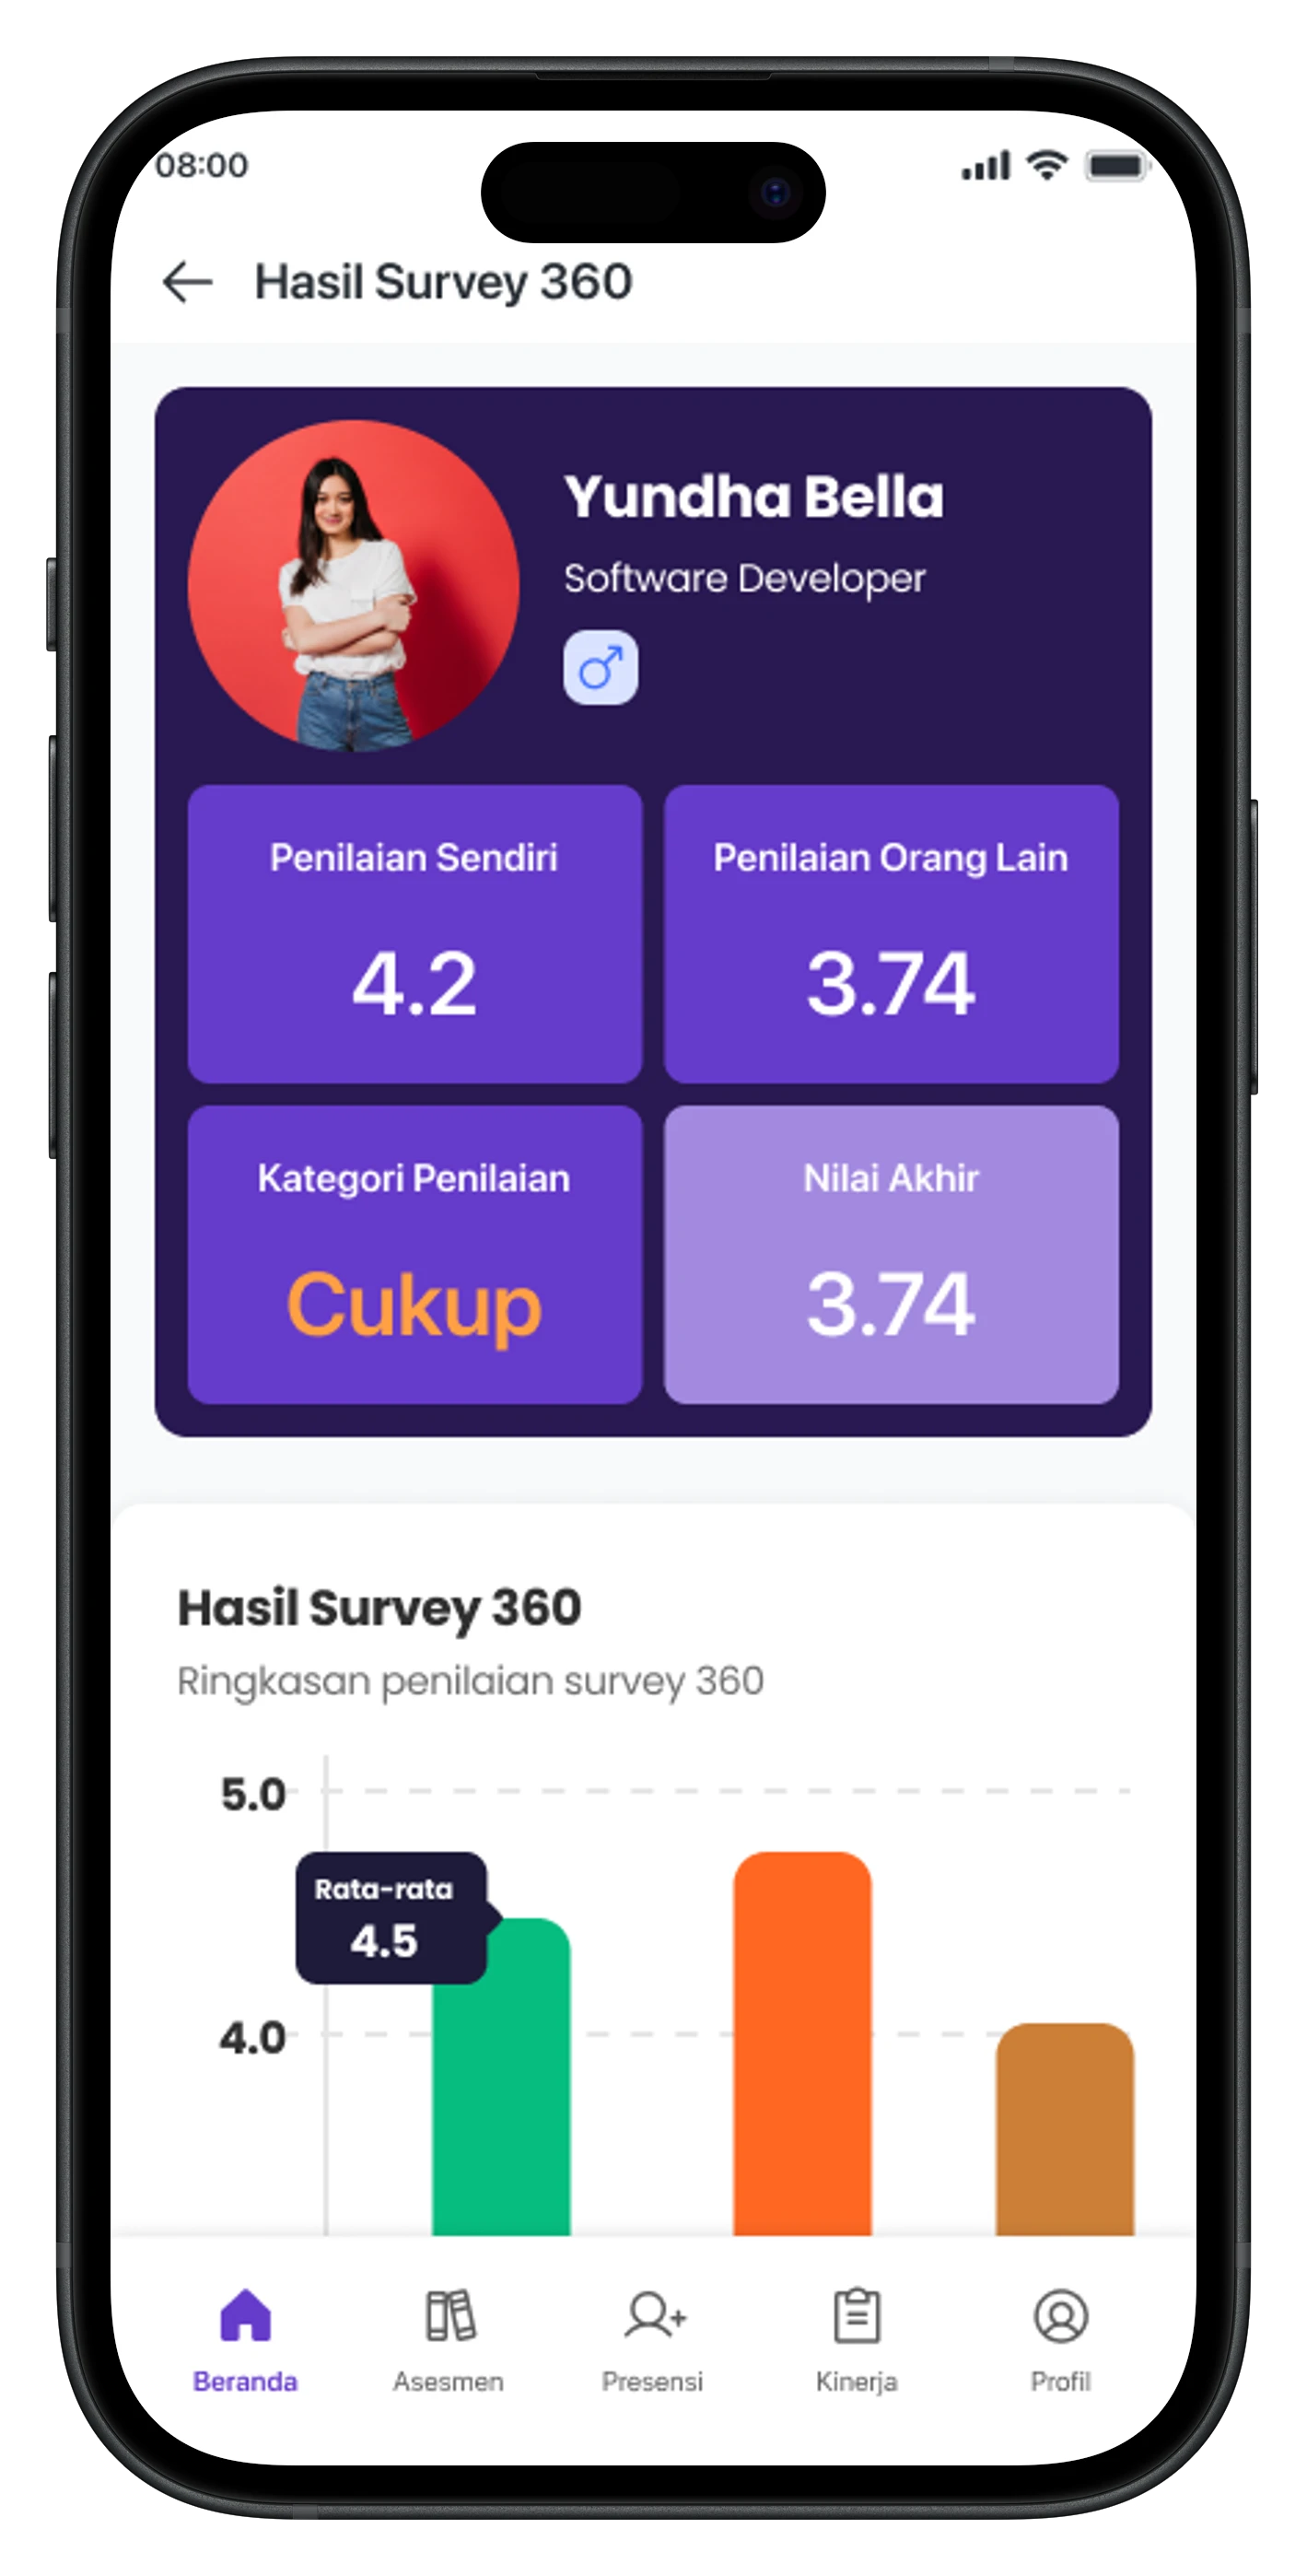
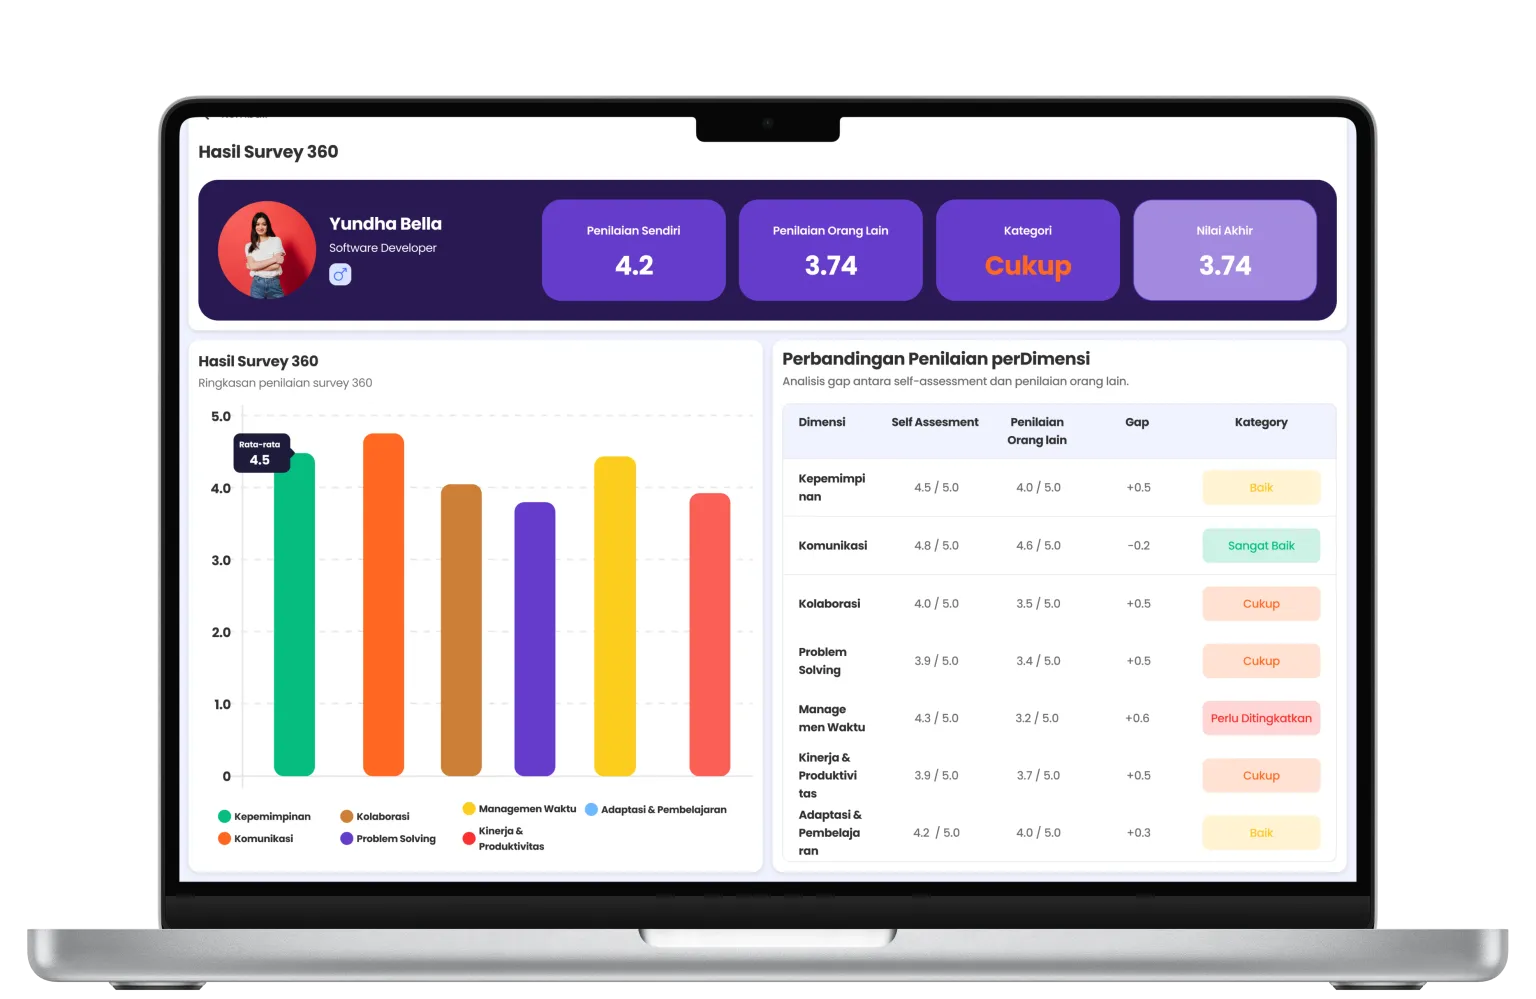
Perspective 360 as Field Reinforcement
Jenjang includes Perspective 360 to capture work behavior visible to the work environment as reinforcement of assessment data and work output data.
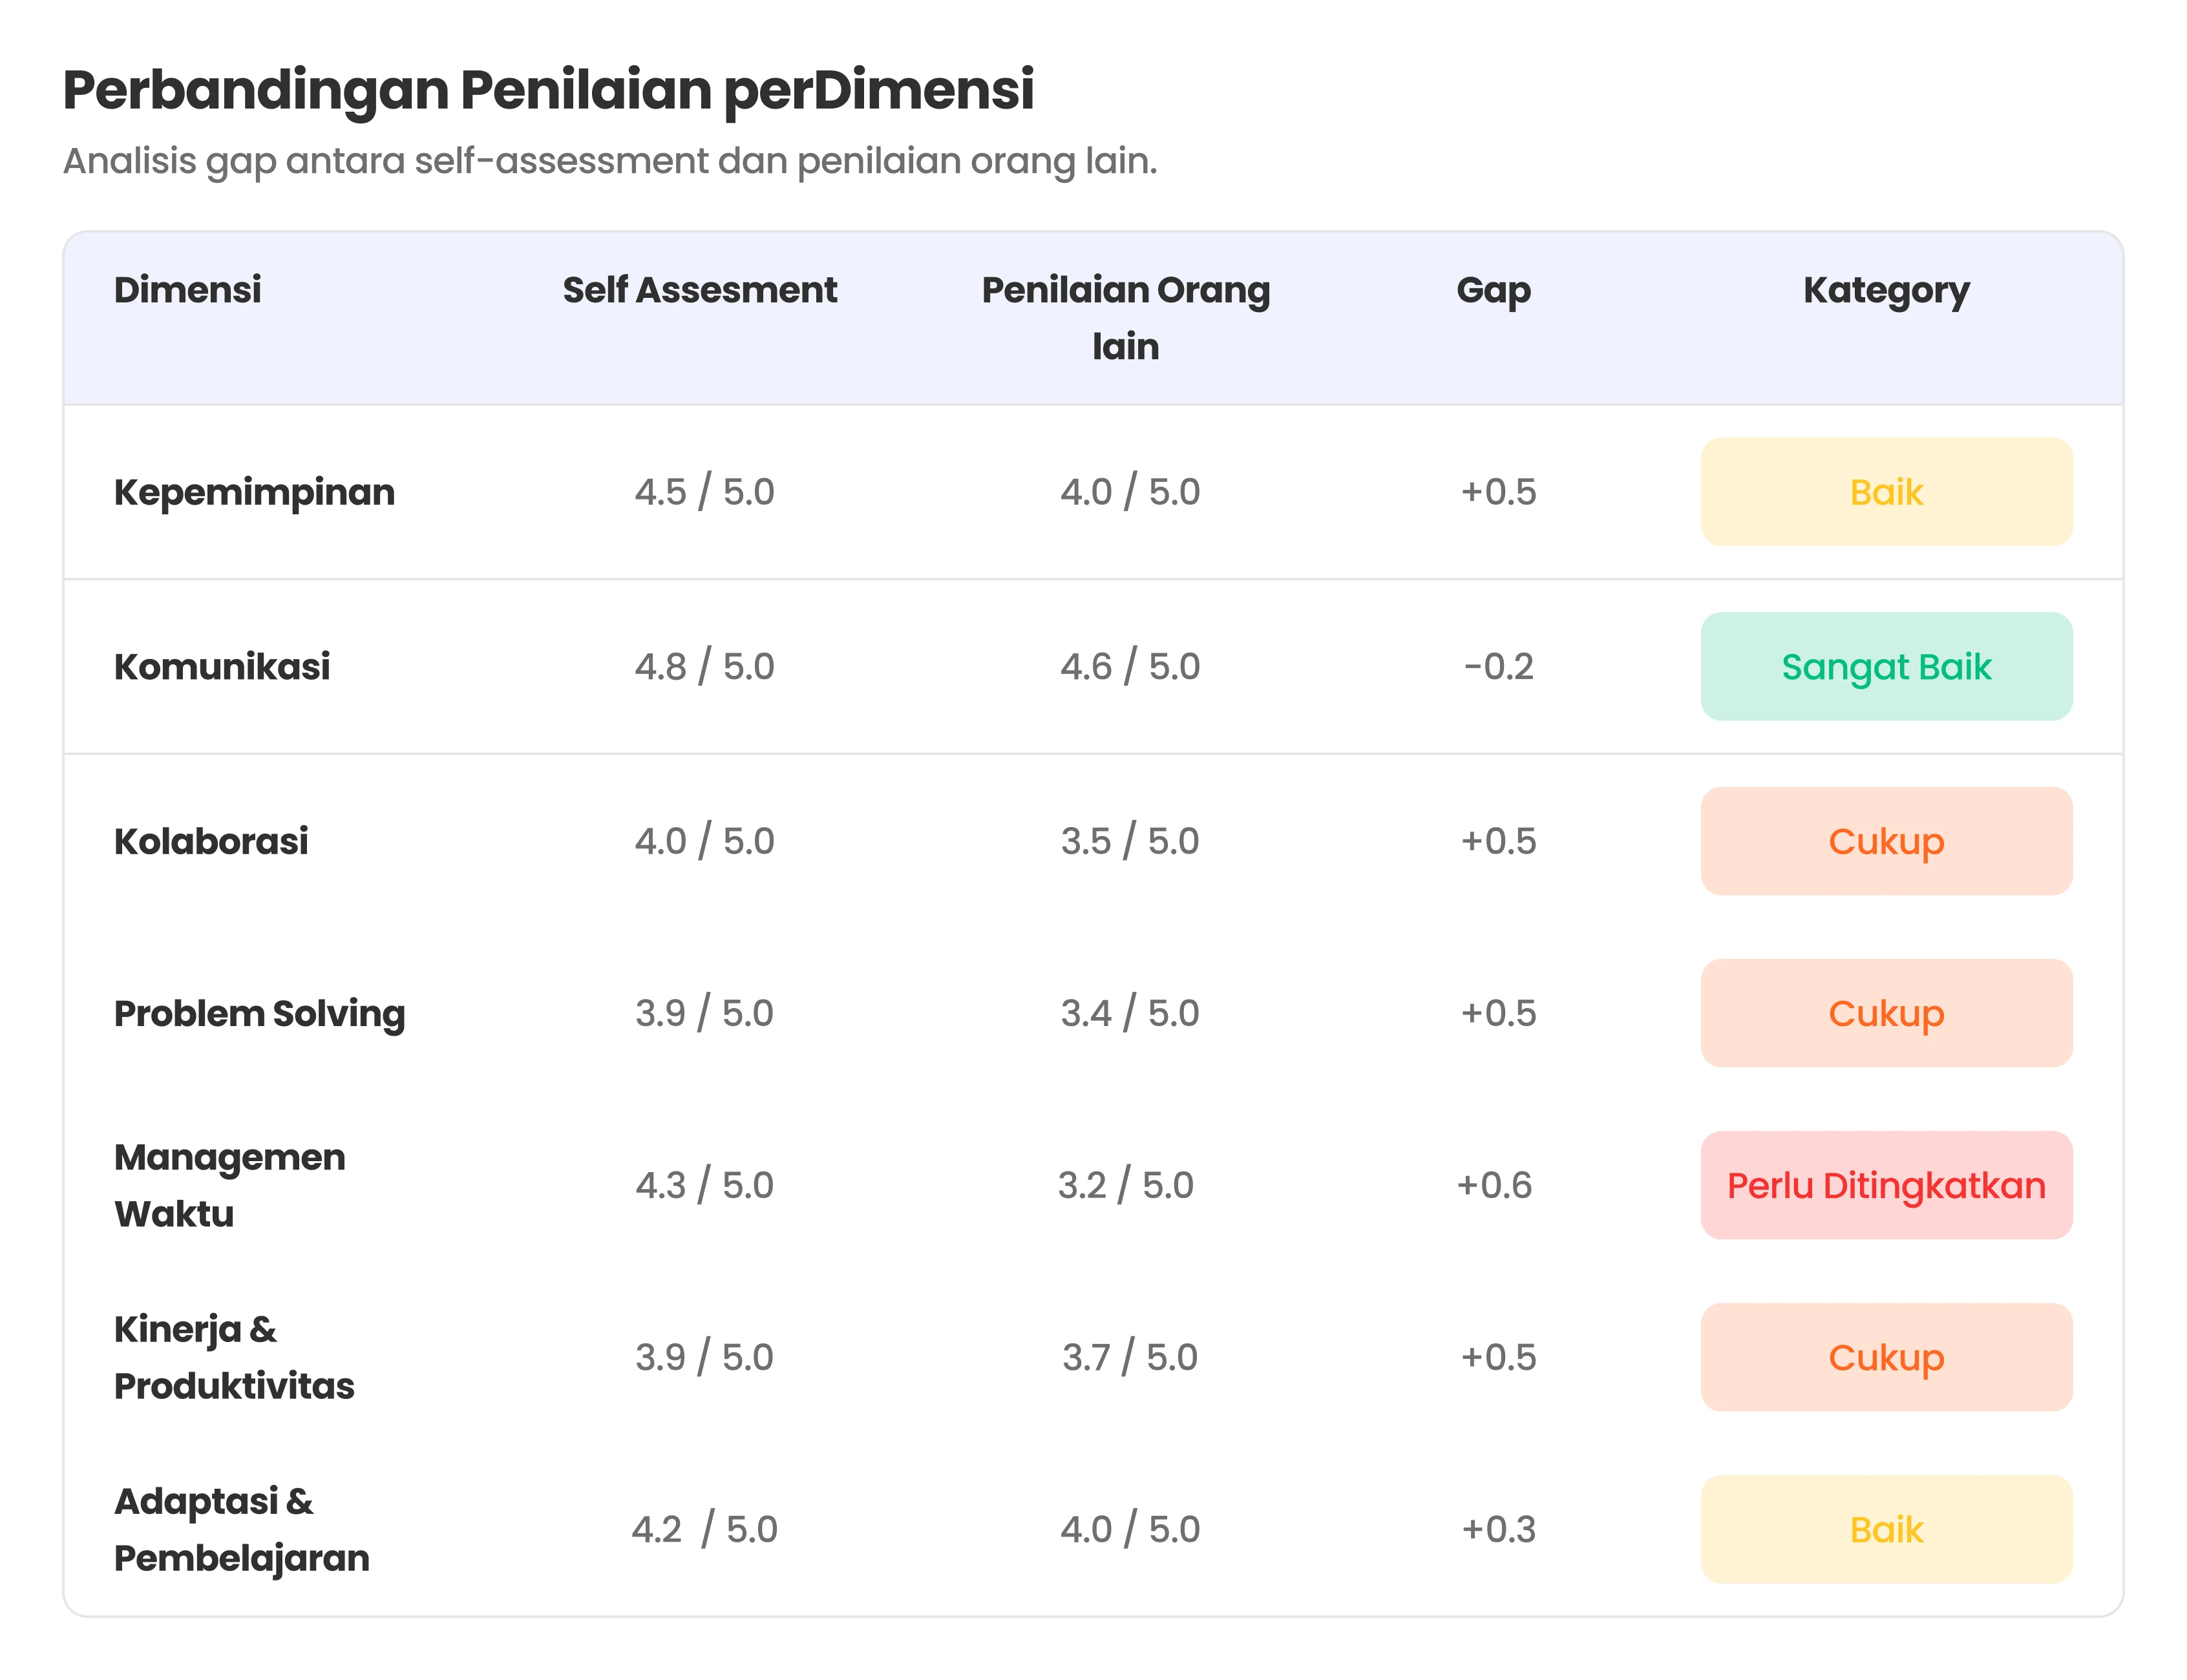
360 Dimensions assessed:
Perspective 360 weight adjusts to data quality, including rater count and recency, so results are more stable and not biased by thin or outdated data.
Output Ready for Decisions
Talent Mapping at Jenjang produces map views and reasoning summaries, so decisions are faster and more accountable.
Talent distribution based on 3 core scores.
Role Fit, Performance, Potential summary + reinforcing factors.
Suggested development focus (role-fit gap / coaching focus).
Compare patterns across departments/teams with the same standard.
Used Together with Other Features
Talent Mapping leverages data from various Jenjang features and its results become input for decisions in other features.
Psychological Assessment
Assessment data becomes a baseline for comparing and evaluating candidates or employees consistently.
Learn MoreATS (Recruitment)
Automated recruitment pipeline from CV intake, Fit Score, to qualification-based interview invitations.
Learn MoreHRIS
Manage employee data, attendance, leave, and other HR activities in one integrated platform.
Learn MorePayroll
Automatically calculate payroll from attendance, overtime, and leave data, with flexible components and layered owner approval.
Learn More1 on 1 Coaching & Counselling
Makes coaching plans more precise from gap/strength areas, not just assumptions.
Learn MorePerformance Measurement
KPI measurement and objective performance evaluation with measurable data baselines.
Learn MoreJob Fit Analysis
Per-dimension fit scores mapped to role requirements to produce clear Fit Score + gaps.
Learn MoreJenjang Digital Identity
Track records and achievements become a valuable, verifiable digital identity.
Learn MoreWhy Choose Jenjang Talent Mapping
Jenjang makes talent mapping more objective because it combines assessment and real work data, then normalizes values for fairness and transparency.
More Complete Picture
Uses 3 core scores (Role Fit-Performance-Potential) for a more complete picture
Based on Real Data
Based on real work data (KPI, validated worklog) + assessment
Perspective 360
Perspective 360 reinforces field behavior with data quality and recency weighting

Fairer Comparison
Values are normalized so cross-team comparison is fairer and more transparent
Clear Data Sources
Easy to explain mapping basis through clear input sources
Accurate Recommendations
Output directly leads to development recommendations and talent decisions
More Complete Picture
Uses 3 core scores (Role Fit-Performance-Potential) for a more complete picture
Based on Real Data
Based on real work data (KPI, validated worklog) + assessment
Perspective 360
Perspective 360 reinforces field behavior with data quality and recency weighting
Fairer Comparison
Values are normalized so cross-team comparison is fairer and more transparent
Clear Data Sources
Easy to explain mapping basis through clear input sources
Accurate Recommendations
Output directly leads to development recommendations and talent decisions

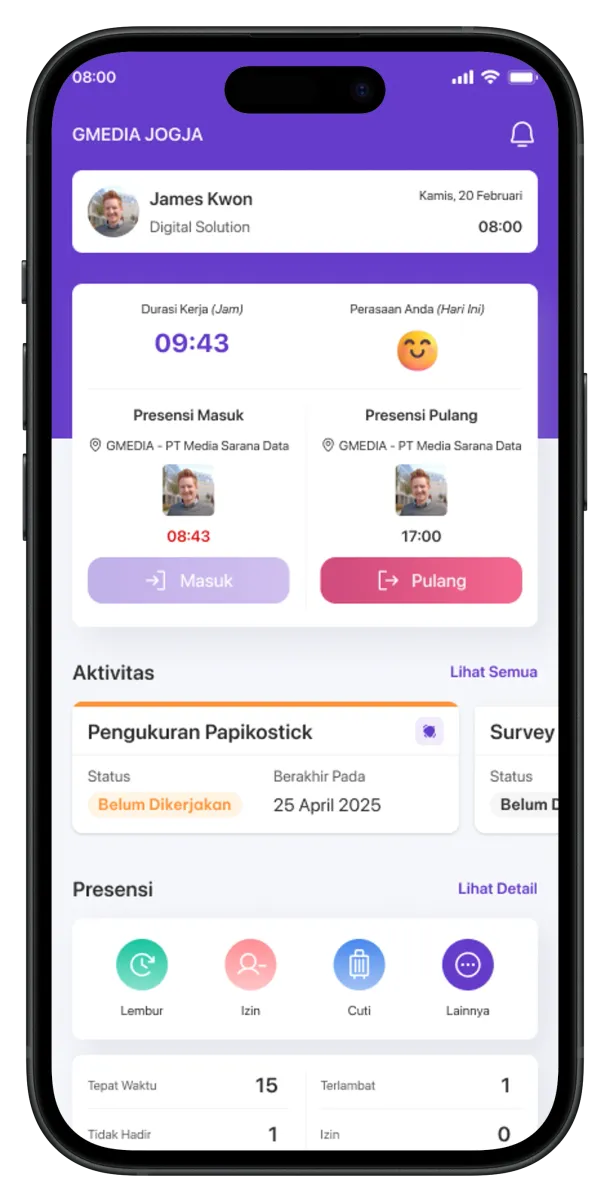
Download Jenjang Now
Access Jenjang Talent Mapping features directly from your smartphone. View talent maps, analyze team performance, and make talent decisions anytime, anywhere.